What the dashboard assesses
ENDURE estimates relative preservation trajectories from local environmental conditions, wreck material and selected biological scenarios. It supports screening, comparison and reporting; it does not prescribe a management decision.
How wreck condition is represented
Navigator uses a simplified four-class adaptation of Muckelroy's wreck-preservation classification, following Gregory et al. The classes describe the observed distribution and structural coherence of wreck remains on the seabed.
Class 1
Coherent, well preserved
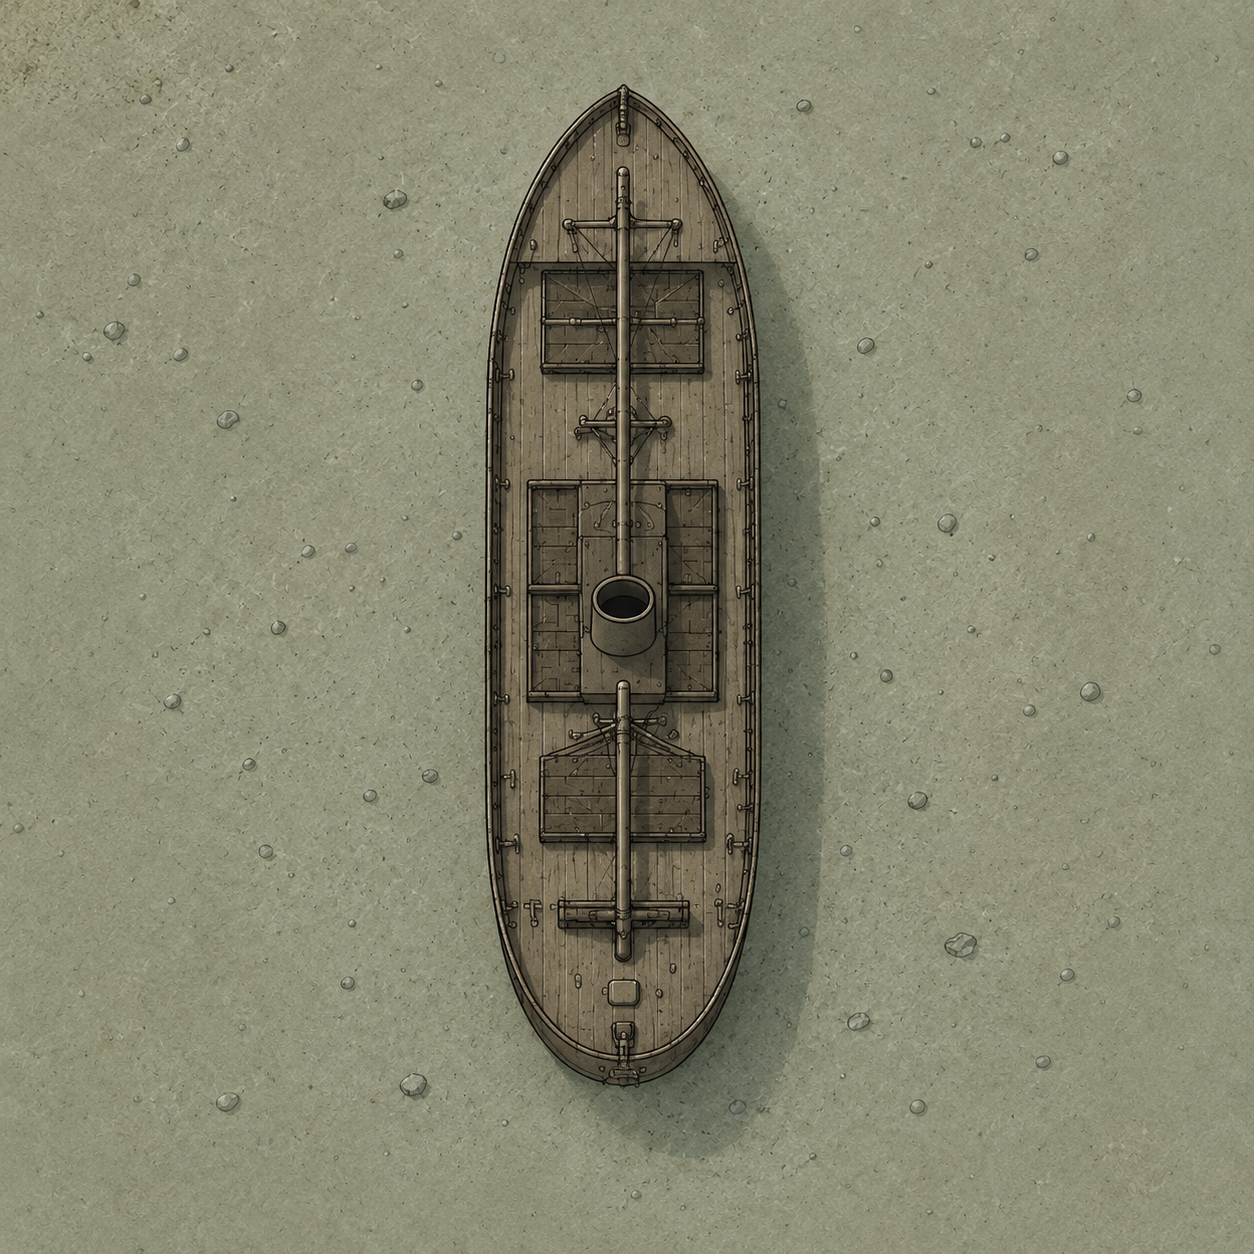
The wreck remains structurally coherent and readily recognisable.
Class 2
Coherent, but incomplete
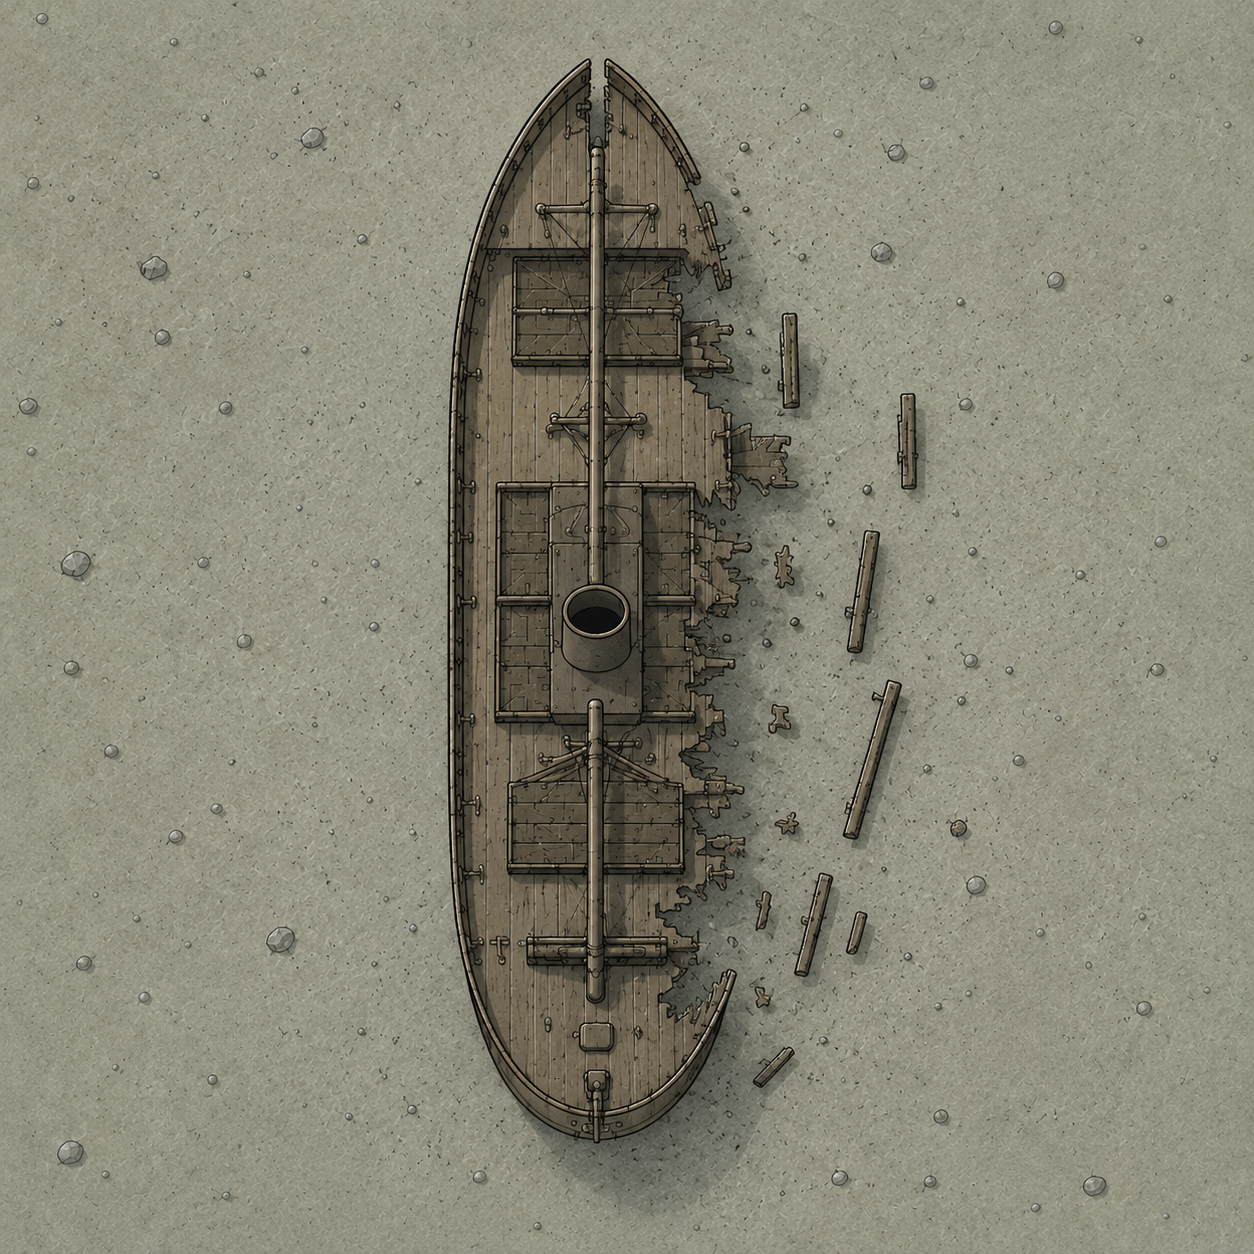
The wreck remains coherent, but parts of the structure have been lost.
Class 3
Scattered, ordered
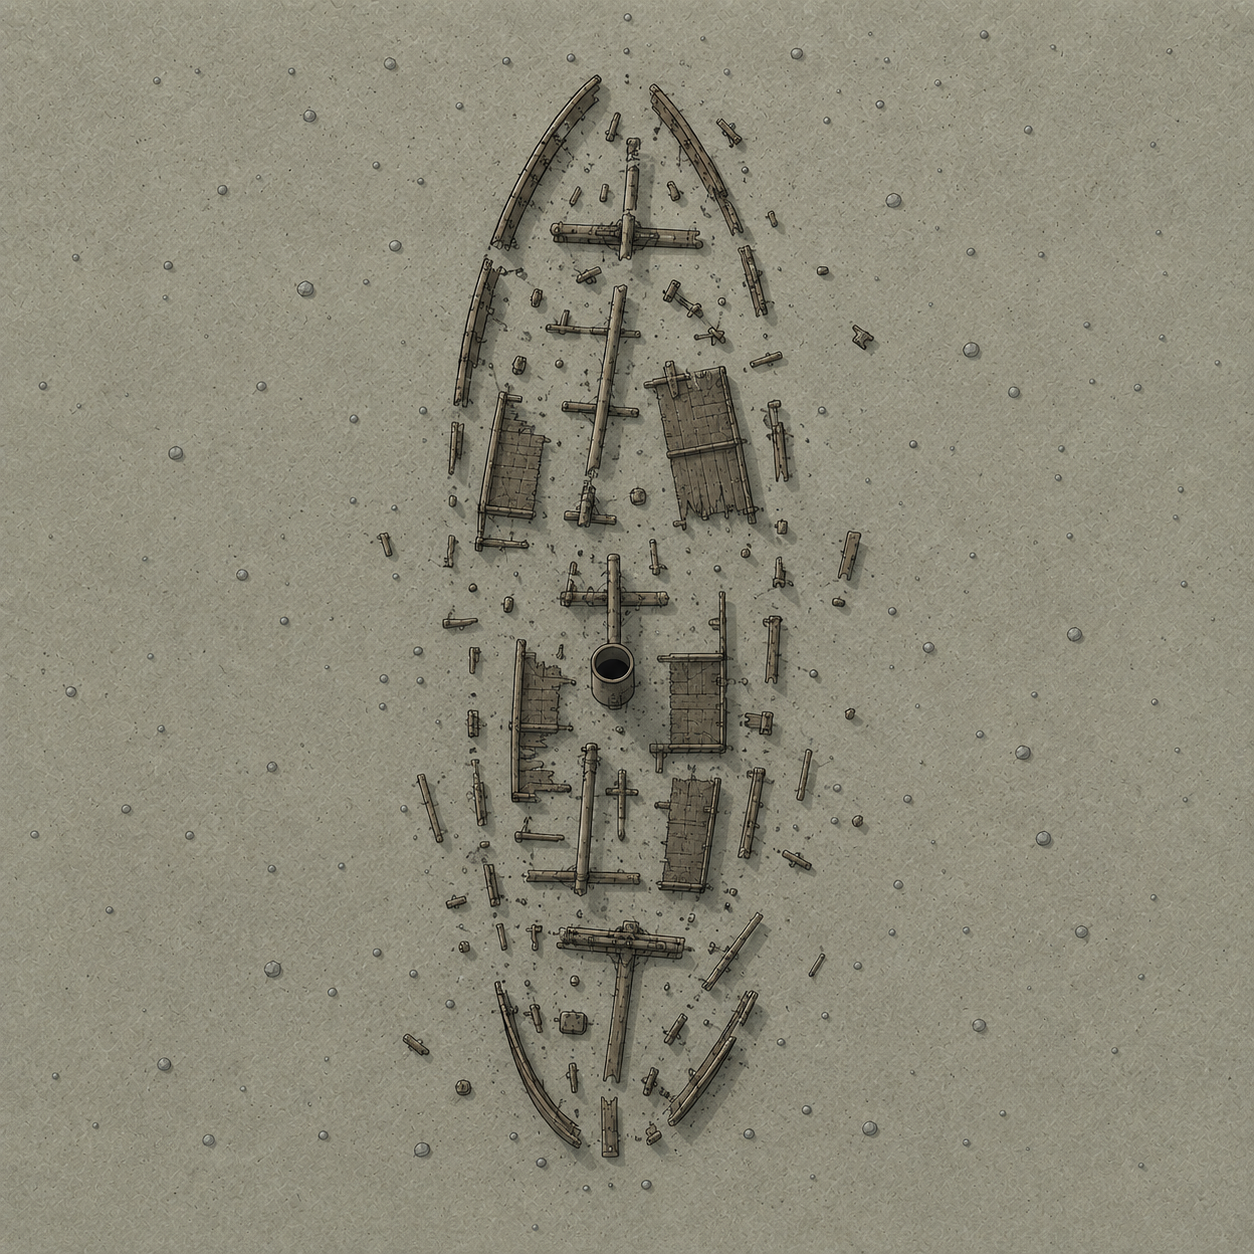
Remains are scattered, but their distribution is still recognisable as a ship.
Class 4
Scattered, disordered
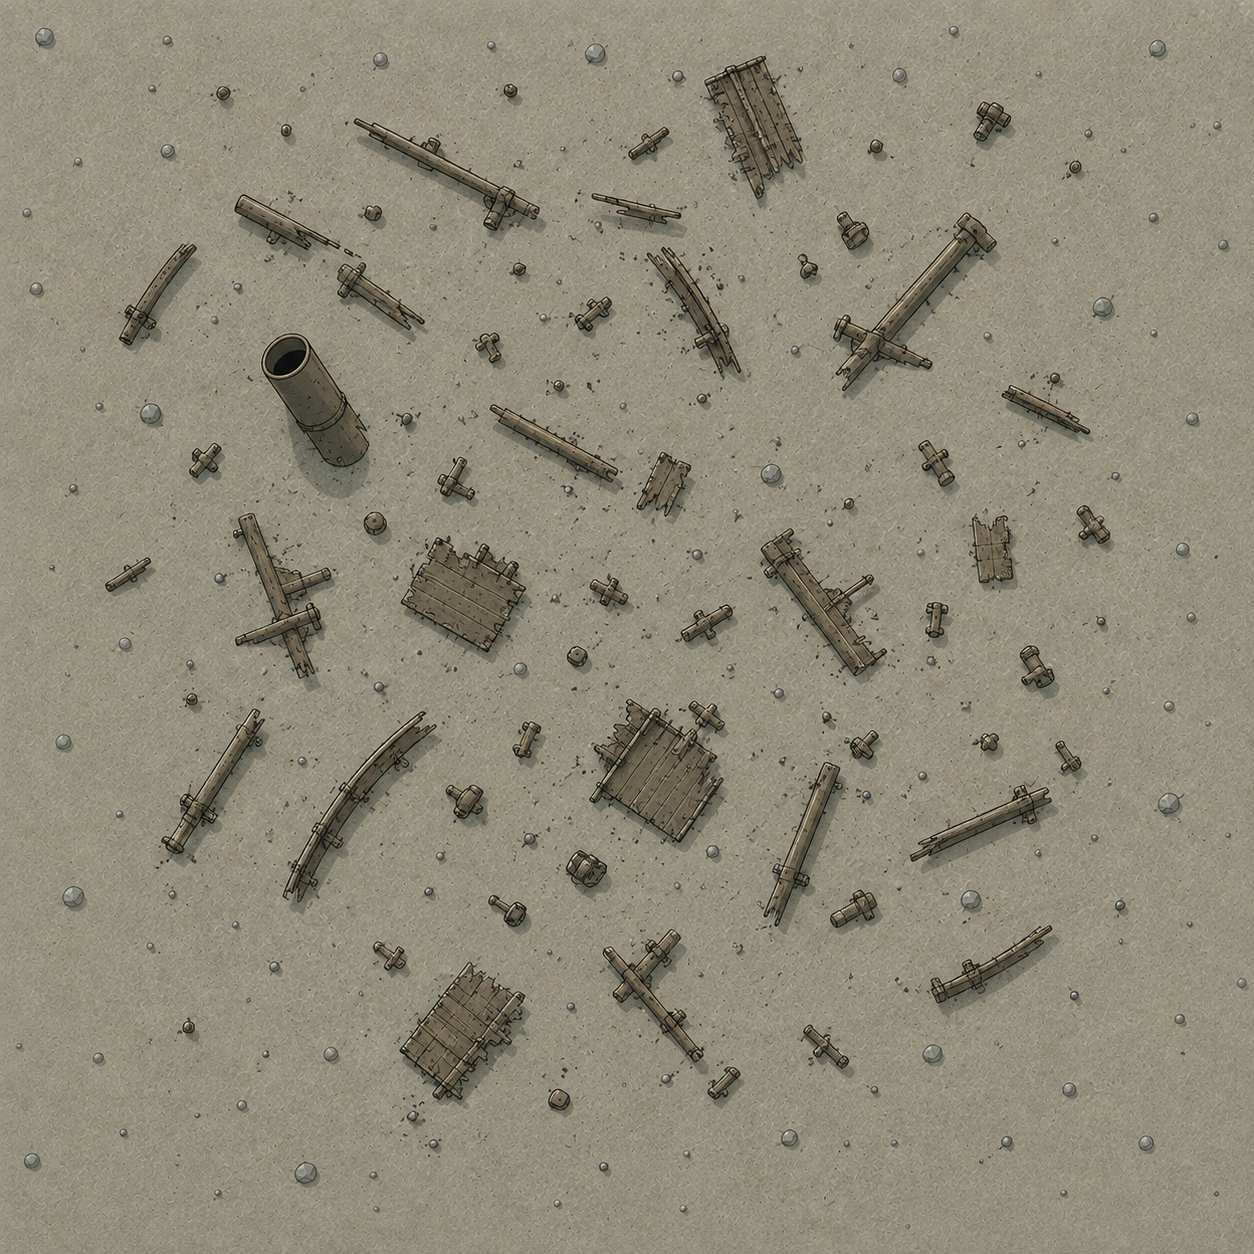
Remains are dispersed and no longer retain an ordered ship-like distribution.
Intermediate condition values. Navigator may use values such as Class 2.5 or 3.5 when estimating deterioration. These represent intermediate positions between the observed condition classes, rather than additional archaeological classes.
Preservation outlook
Critical, High, Moderate and Low translate the modelled time to a selected condition threshold into management-facing bands.
- Critical: less than 20 years
- High: 20–50 years
- Moderate: 50–100 years
- Low: 100–300 years
- Beyond 300 years: threshold not reached within the model horizon
Time to threshold
This is the estimated time until the selected degradation class is reached.
- Observed current condition supplied: the forecast begins at the assessed condition today.
- Current condition not supplied: the trajectory is modelled from sinking.
These are different forecast origins and should not be interpreted as equivalent evidence.
Dominant deterioration process
The dominant process is the largest relative modelled contribution at the assessed site; it is not necessarily the only process operating.
- Steel corrosion
- Wood physical deterioration
- Biological deterioration
- Teredo activity
Environmental setting
The dashboard translates technical environmental values into short descriptors that can be used in screening and reporting.
- Depth
- Salinity regime
- Hydrodynamic exposure
- Burial protection
- Temperature regime
Assessment confidence
Assessment confidence describes the support and scenario dependence of the result. It is not the probability that the forecast is correct.
Wood and mixed-material assessments are less directly supported by the principal steel calibration pathway. Teredo scenarios add an explicit scenario qualification because they represent relative intensity rather than measured local attack rates.
How the outputs should be used
- The dashboard generates the observation, interpretation and management relevance.
- The final management decision remains with the user and should also consider significance, legal status, survey evidence, costs and operational constraints.
- Portfolio rankings describe preservation vulnerability, not overall cultural or management priority.
Important limitations
- Calibration support is strongest for steel wrecks.
- Wood and mixed-material pathways are more exploratory.
- Teredo levels are relative scenarios, not measured local attack rates.
- Current environmental conditions are treated as representative.
- Time to condition class is not time to structural collapse.
- Regional model cells may not resolve fine-scale site heterogeneity.
- Snapping is reported and constrained during portfolio validation.
Dashboard workflows
- Spatial management: explore regional preservation patterns and scenarios.
- Known-site assessment: assess one identified location and, where known, its current condition.
- Portfolio assessment: validate, compare and summarise multiple known sites.
- Scientific evidence: inspect the model basis for the selected spatial location.